


Top and Bottom Performers in Venture Capital
When you’re an emerging manager, it’s often useful to get out out your own head and think like an allocator.
Following up from the last article on why pensions go with Big VC firms despite the drop in performance, it comes
Distributions to Paid-In Capital (DPI) is a crucial metric for venture capital (VC) funds, measuring how much capital has been returned to investors relative to what they contributed. Understanding DPI benchmarks across different fund sizes helps investors gauge performance expectations and risk levels.
Let’s look at DPI benchmarks for top-performing and bottom-performing VC funds, based on fund size.
Top DPI Performance by Fund Size
The highest-performing VC funds generate significant DPI, often driven by early-stage investments in breakout companies. However, these exceptional funds are rare. Here’s a look at how DPI varies among the top 10% and top 1% of funds:
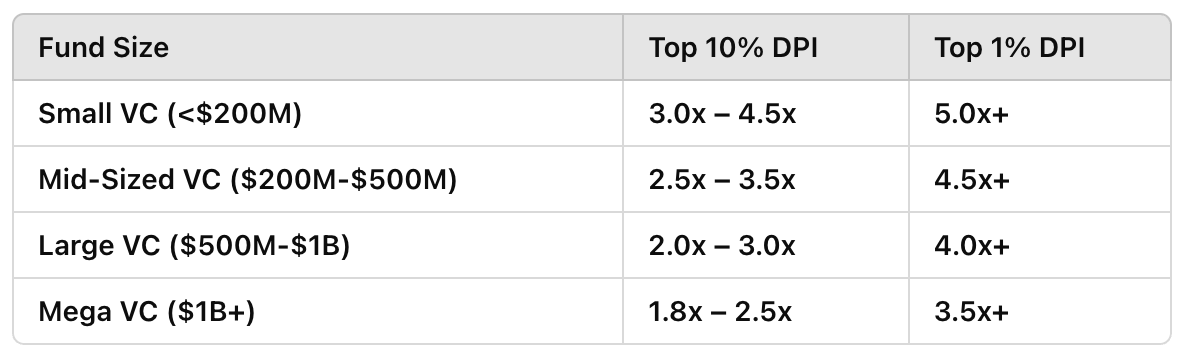
Key Insights:
Small VC funds (<$200M) tend to have the highest potential for outsized DPI returns due to early-stage investments in high-growth startups.
Mid-sized and large VC funds ($200M-$1B) have slightly lower DPI peaks but can still achieve high multiples when investing in companies that successfully exit.
Mega funds ($1B+) tend to have the lowest top-tier DPI figures since they often focus on later-stage deals, which provide more stability but lower returns.

Bottom DPI Performance by Fund Size
Not all funds achieve strong returns. The bottom 10% of funds struggle to return capital to investors, often due to failed investments, lack of liquidity, or market downturns. Here’s how DPI benchmarks look for the worst-performing funds:
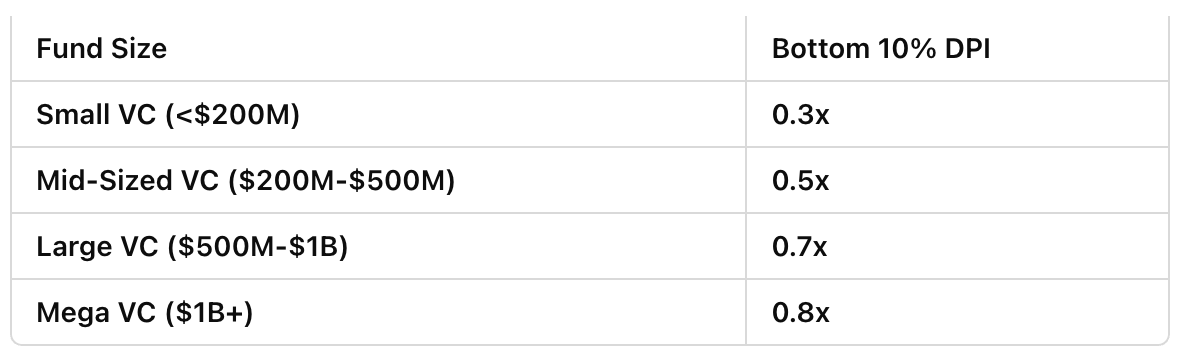
Key Insights:
Small VC funds (<$200M) have the highest volatility, with some funds failing to return even a third of the capital invested.
Mid-sized and large VC funds ($200M-$1B) have slightly better downside protection, but failures still result in low DPI.
Mega funds ($1B+) typically have the highest minimum DPI, as they invest in more mature companies with lower risk profiles.

DPI performance varies significantly based on fund size, investment strategy, and market conditions. While top-performing funds can achieve DPI of 3x-5x+, the bottom 10% of funds may struggle to return even 1x. Investors should carefully evaluate a fund’s track record, portfolio strategy, and historical DPI benchmarks before committing capital. Understanding these DPI distributions helps set realistic expectations and identify potential high-performing opportunities while managing downside risk.
For an emerging manager, these DPI benchmarks highlight the importance of aligning fund size with strategy and risk tolerance. Smaller funds have the potential for outsized returns but come with greater volatility, meaning disciplined portfolio construction and liquidity management are crucial. Mid-sized funds may offer a balance of risk and reward, while larger funds provide stability at the cost of lower upside.
Understanding where your fund fits within these benchmarks can help set realistic return expectations and refine investor conversations. Ultimately, emerging managers must focus on demonstrating a strong investment thesis, clear value-creation strategies, and the ability to generate meaningful distributions to attract and retain LPs.